Are you preparing for your Unit 3 General Maths IA2 Short Answer test? Well we’ve got some questions that can help you get lots of prep in!
In fact, we’ve come up with 20 simple familiar and complex familiar practice questions with the answers, so that you can check which areas you aren’t your strong points and can improve on.
So let’s get into those questions!
Short Answer Practice Questions
Question 1 (5 marks)
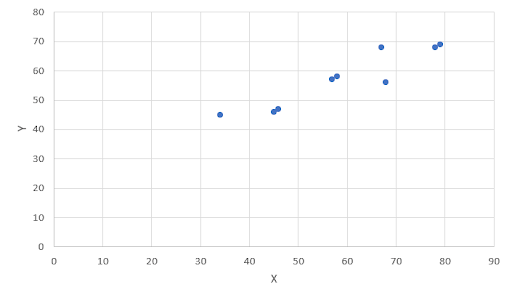
Describe the strength, direction, and shape of the correlation below. Is it appropriate to calculate the correlation coefficient for this data? Why?
Question 2 (2 marks)
Calculate the correlation coefficient of variable P, with a variance of 9, and variable Q, with a variance of 16. Covariance between these two variables is 9.
Question 3 (2 marks)
If r = 0.45, the variance of X is 14.3 and the variance of Y is 13.2, what is the covariance?
Question 4 (4 marks)
Assume that the data between temperature and turtle population in the Galapagos Islands is correlated such that r = 0.77. Determine the coefficient of determination, and interpret it in terms of temperature and turtle population.
Question 5 (6 marks)
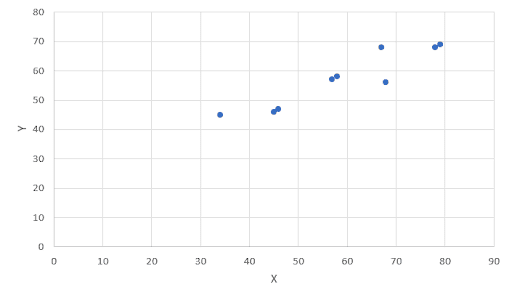
A student conducted a study investigating two variables, x and y.
(a) Describe the relationship shown on the scatterplot. (3 marks)
(b) The student realised he made a mistake recording the data, whereby the point (89,54) was measured inconsistently compared to the other datapoints. He decides to remove it to improve the integrity of his dataset. What effect would this have on the correlation coefficient compared to when it was measured considering the outlier? (3 marks)
Question 6 (3 marks)
Use your calculator to determine and comment on the correlation coefficient of this data.
X 22 34 56 23 12 78 97 Y 24 45 56 45 24 26 36
Question 7 (6 marks)
Given the following information, determine the equation of the regression line, and identify which of the two variables, A or B, is explanatory, and which is response.
r = -0.81 mean of A = 34.8 mean of B = 78 SD of A = 3.64 SD of B = 4.6
Question 8 (3 marks)
An equation for a linear regression is calculated.
(a) The slope is found to be negative. What does this tell us about the sign of the correlation coefficient? (1 mark)
(b) The correlation coefficient is zero. What does this tell us about the slope of the regression? (1 mark)
(c) The correlation coefficient is zero. What does this tell us about the intercept of the line? (1 mark)
Question 9 (1 mark)
Explain the difference between association and causation.
Question 10 (1 mark)
Explain the difference between an Explanatory Variable and a Response Variable.
Question 11 (3 marks)
Given the equation 40.5 + 4.3 x distance = A, where the coefficient of determination is 0.497, determine:
(a) The slope of the regression, and interpret its meaning. (2 marks)
(b) A when distance = 5.6m (1 mark)
Question 12 (3 marks)
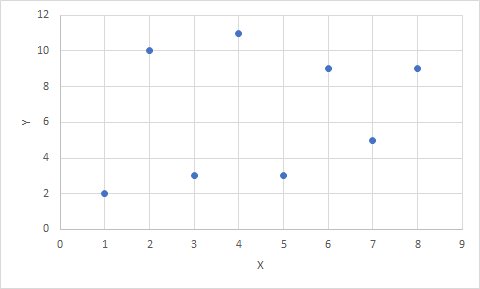
The assumption that two variables X and Y are linearly correlated is made. Examine the residual plot below and determine whether the assumption is true, explaining your reasoning.
Question 13 (4 marks)
In a recent study across a number of countries the correlation between carbon dioxide levels in the atmosphere and the concentration of oxygen in seawater was found to be 0.30, whilst the correlation between carbon dioxide levels in the atmosphere and ocean temperature was found to be 0.689.
(a) Interpret each correlation coefficient in terms of the variables in the study. (2 marks)
(b) Which of the variables is impacted more by the carbon dioxide level in the atmosphere? Explain your answer. (2 marks)
Question 14 (2 marks)
What is the advantage and the disadvantage of executing a smoothed mean analysis?
Question 15 (1 mark)
What is the practical difference of executing a 5-point smoothed mean compared to a 3-point smoothed mean?
Question 16 (4 marks)
Execute a 3-mean smoothing on this dataset.
X 56 56 57 68 34 45 56 78 89 78 89 80 Y 57 68 79 68 79 48 79 67 58 90 70 46
Question 17 (4 marks)
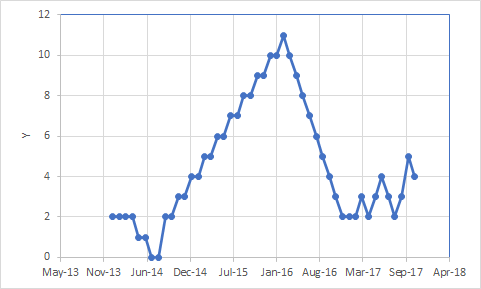
Describe the following graph in terms of its cycles, outliers, seasonality, and trends.
Question 18 (4 marks)
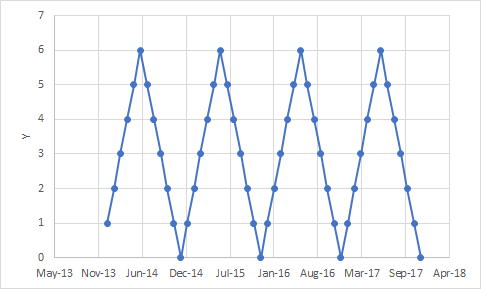
Describe the following graph in terms of its cycles, outliers, seasonality, and trends.
Question 19 (4 marks)
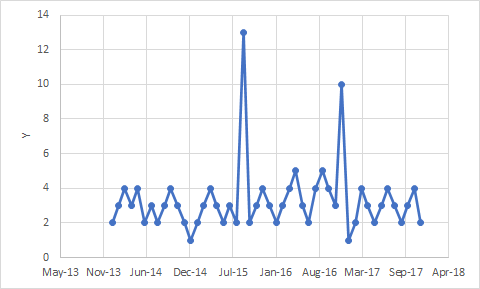
Describe the following graph in terms of its cycles, outliers, seasonality, and trends.
Question 20 (4 marks)
Calculate the four-mean smoothed temperature centred on Thursday.
Day Monday Tuesday Wednesday Thursday Friday Saturday Sunday Degrees (C) 13.2 14.5 16.4 14.5 17.4 15.4 17.4
QCAA Unit 3 General Maths Short Answer Practice Solutions
Click here to download the solutions to the 20 practice questions above!
When you get your IA results back for this assessment, you should plug them into our QCE Cohort Comparison Tool and see how you’re tracking for your goal ATAR!
Are you looking for some extra help with the QCAA Unit 3 General Maths IA2 Short Answer test?
We have an incredible team of QLD tutors and mentors!
We can help you master the General Maths syllabus and ace your upcoming General Maths assessments with personalised lessons conducted one-on-one in your home or online!
Do you know why Term 2 is the most important term of the QCE for many students? Read more here!
We’ve supported over 8,000 students over the last 11 years, and on average our students score mark improvements of over 20%!
To find out more and get started with an inspirational QLD tutor and mentor, get in touch today or give us a ring on 1300 267 888!
Vittorio Manessi is an Art of Smart tutor based in Queensland studying environmental science. He was one of the first Year 12 students to study under the new ATAR system in Queensland. He enjoys Maths, Science, English and Ancient History and is keen to share his knowledge of the QCE by making awesome resources.

