Just got your IA results back and have no idea how your marks actually compare with the rest of QLD?
Unsure if your marks are on track to achieve your goal ATAR or not?
There’s good news! With Art of Smart Education’s ‘QCE Cohort Comparison Tool’ you can now:
- Insert your IA results across each of your subjects
- Find out how your IA results rank against EVERY student in QLD studying the same subject
- Find out if your IA result is on track to achieve your ATAR goal or if you have work to do!
Check it out below!
Introducing the QCE Cohort Comparison Tool
Understanding the Importance of Knowing Your Position
Just because your marks appear to be high doesn’t mean you are actually ranked high up in your cohort… 😮
For example, an 88% in Physics, as good as it sounds, may only mean you are in the top 39% of students!
With this tool, you’ll get greater insight into how you’re tracking towards your goal ATAR and subjects where you may need to improve — motivating you to keep going and striving for higher marks! We’ve created the ‘QCE Cohort Comparison Tool’ with the specific aim of giving students this much-needed perspective.
How Does the QCE Cohort Comparison Tool Work?
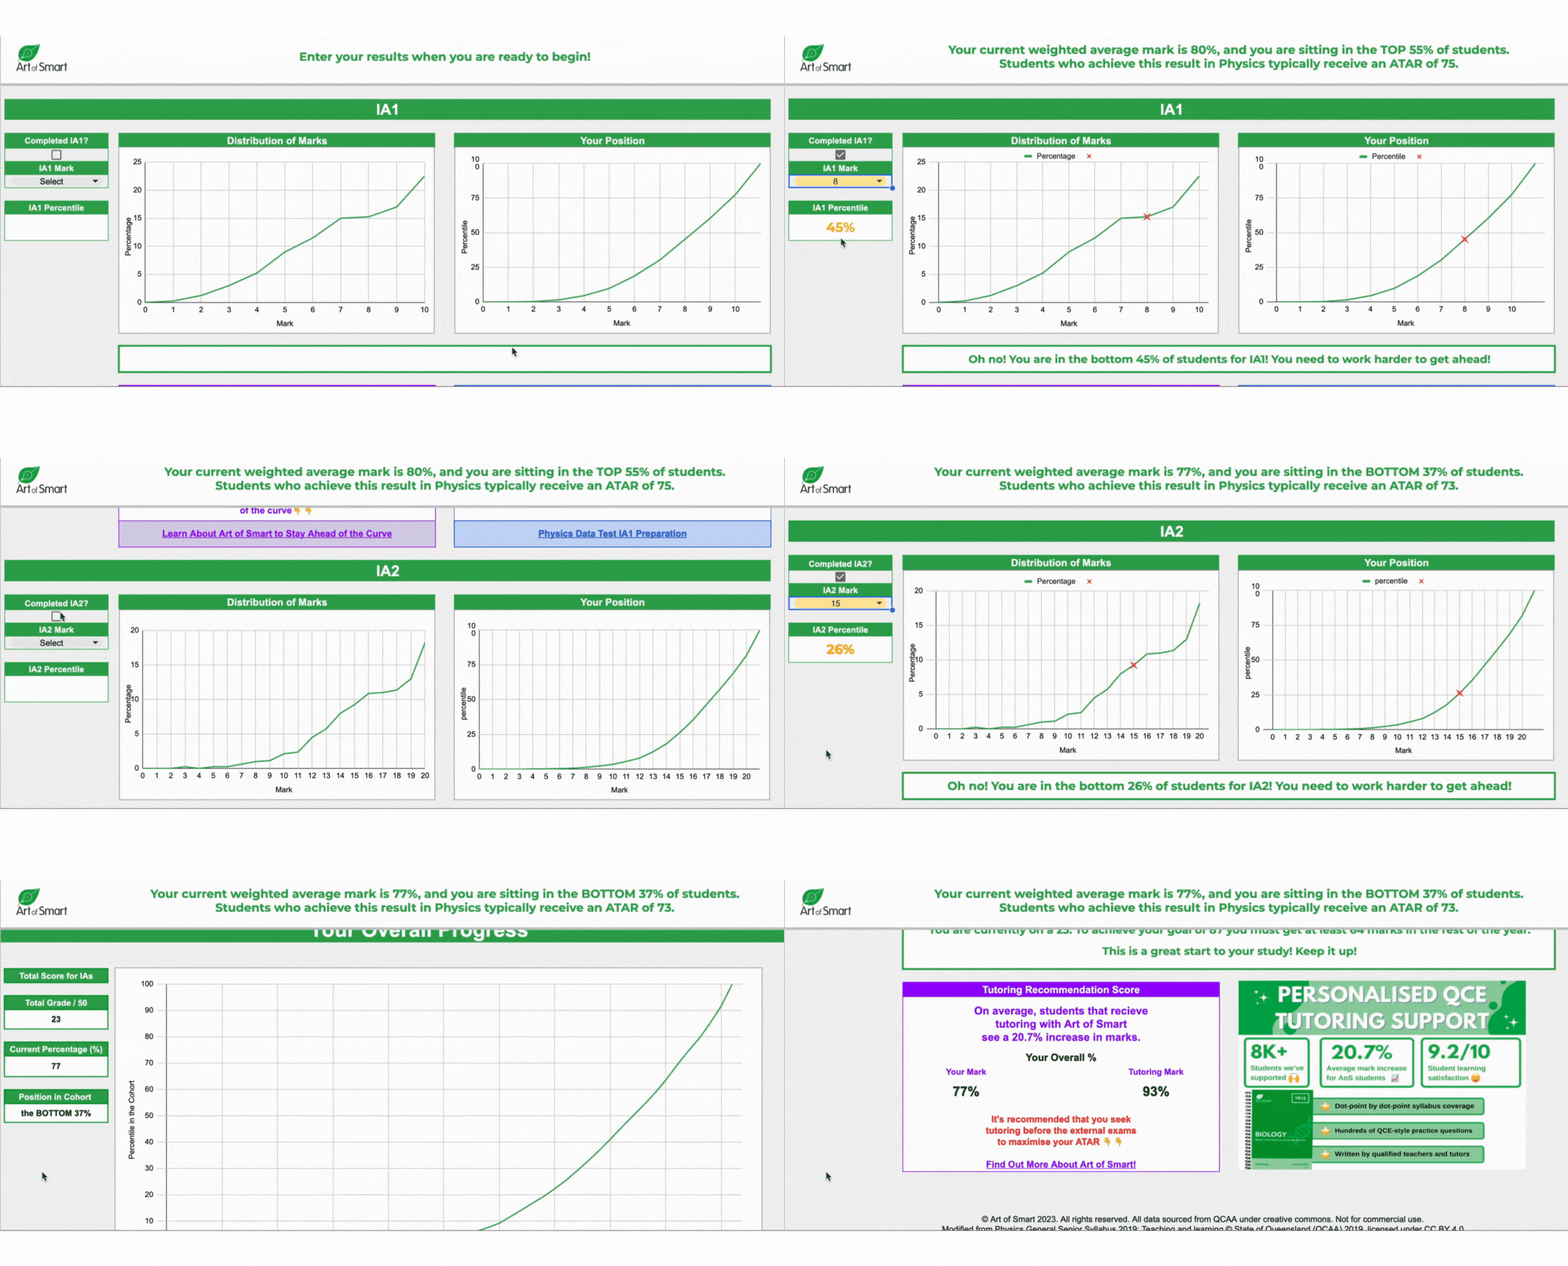
Simply download the Google Sheet, enter in your marks, and your insights will be there! Simple, right?
Well, there’s a little more than goes on behind the scenes. By using data which QCAA releases at the end of each year, we can see how many students score each mark for each individual assessment and for the overall year!
Using this information, we can graph your position against the rest of the previous year’s cohort data, and predict where you are likely to sit compared to your current cohort!
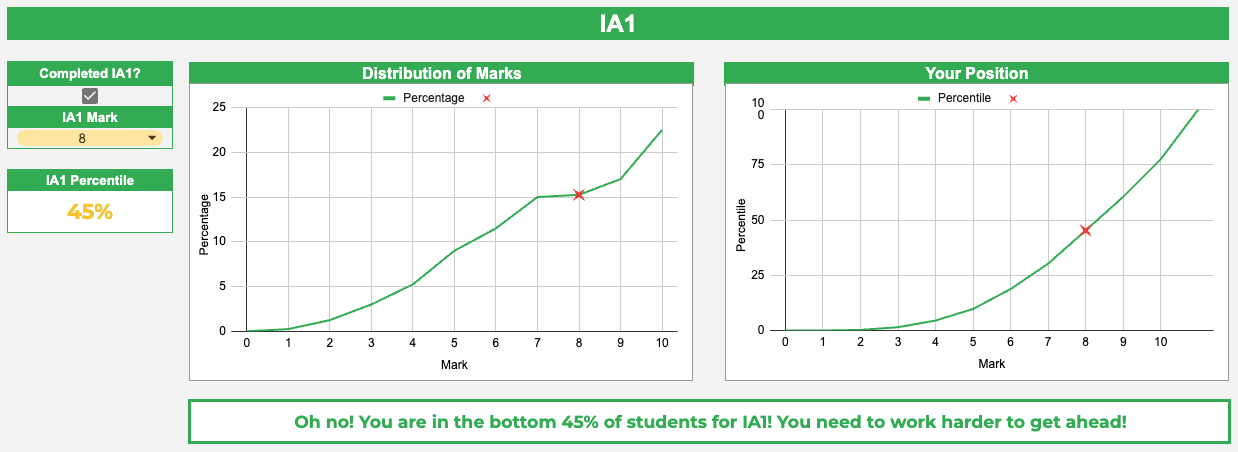
For example, if you achieved an 8/10 for the Physics IA1, you’d expect to be doing pretty well right? Actually, you would be sitting in the bottom 45% of Physics students, even though you only missed two marks!
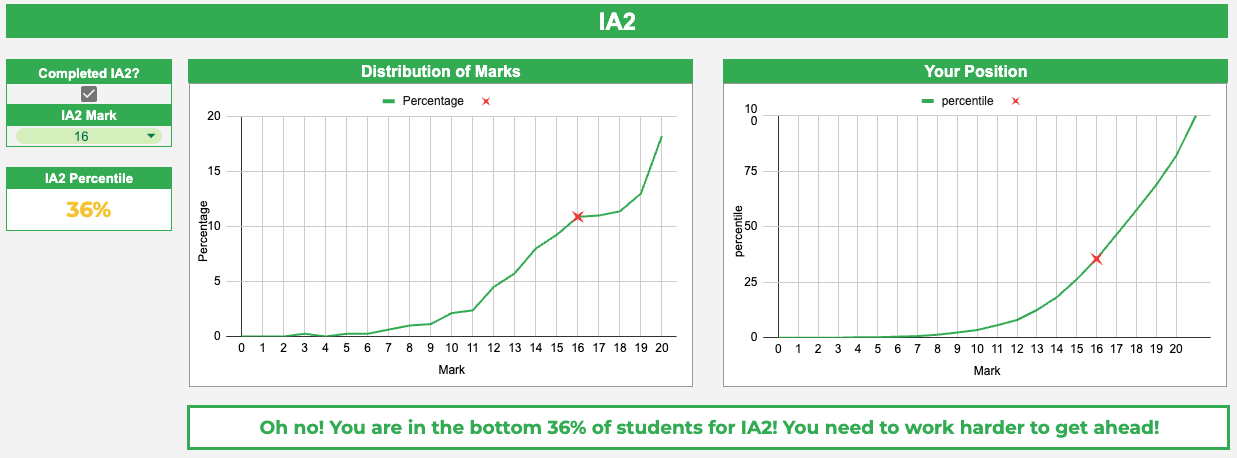
Then, if you achieved a 16/20 on your Physics IA2, again, only a few marks lost, but you’re down to the bottom 36% of students for this assessment, and in the bottom 43% overall!
Then, using that information we can predict that your ATAR will be somewhere in the ~79 range.
How Can You Use The Tool?
#1: As a Wake-Up Call!
Sometimes, all you need to wake up to the reality of your marks is to visually see the data! We didn’t make this tool to create unnecessary stress, but to actually avoid it!
Through this tool, we hope that students, like yourself, will be able to understand where they truly sit in their cohort, so they can map out a plan of attack and work harder towards where they want to be.
Give some solid thought to where you are, and where you thought you were. Were you expecting your marks to land you where you actually are within your cohort?
Need some help to find resources for Term 3 of the QCE? Check out our Ultimate Term 3 Content Guide!
#2: Setting Realistic Goals for Academic Progress
As a student, setting goals is crucial to keep yourself motivated and succeed in your academics.
A lot of the time, students will set random numbers for goals marks, that sound pretty high — this isn’t the right approach to take! With the ‘QCE Cohort Comparison Tool’, you’ll be able to set more realistic and achievable targets based on where you currently stand, and see where those goals will lead you at the end of the year!
By tracking your progress over time, you can celebrate your improvements and stay motivated to work harder toward achieving your goals and ATAR!
Either plug in the results you have achieved, and work out what you will need to aim for the rest of the year, or use the tool to work backwards from where you need to be, to where you are.
Find out what IA1 mark you need to be on track for an ATAR over 90!
#3: Understanding Your Results from Visualising Your Marks
Numbers alone may not always paint a clear picture. Our ‘QCE Cohort Comparison Tool’ takes the hard-to-understand data and plots it into a simple Google Sheets calculator, presenting your academic standings in easy-to-understand graphs and charts. This visual representation helps you grasp your progress and areas of improvement effortlessly.
It also offers a visual reminder of what the bell-curve actually looks like! Looking at the distribution of marks for each subject, we can gather valuable insights into which subjects are experiencing the ‘ceiling effect’, such as Specialist Maths and Chemistry, and which are not, like General Maths. It may be easier to get ahead of the curve in some subjects, yet impossible in others!
Curious about the difference in ATAR results between co-ed and single-sex schools? Check out the top Boys, Girls, and Co-ed schools in Brisbane!
So there you have it!
Now you’ve gained access to the ‘QCE Cohort Comparison Tool’, you are able to compare your marks to where the rest of your cohort is sitting, and gain valuable insights into how you are really going for your ATAR.
Use these insights to guide your study and priorities headed into the rest of the year, and push yourself up above the rest of your grade to secure your ATAR score!
Wondering if assessments are different in year 12? Find out here!
Looking for some help with the IAs?
Stuck completing your REAL IA1 at the end of Year 11? Don’t get caught out with these 5 tips for acing a Year 11 IA1!
IA1
- Physics Data Test Practice
- Questions for the Chemistry Data Test
- Biology Data Test Preparation
- The Ultimate Guide to the Math Methods PSMT
- How to Write the General Maths PSMT
The Exhaustive Guide to Acing Term 1 of Year 12 in QLD and why you feel like Year 11 is overwhelming!
IA2
What to do if you are disappointed with your first assessment results!
- How to Ace the Chemistry Student Experiment
- How to Achieve an A on the Physics Student Experiment
- Biology Student Experiment – The Ultimate Writing Guide
Read our article on why Term 2 is the MOST Important Term of the QCE
IA3
- The Ultimate Chemistry Research Investigation Guide
- The Top Physics Research Investigation Guide
- How to Ace Your Biology Research Investigation
Curious about which schools in Brisbane are the best? Find out with our Ultimate Brisbane ATAR School Ranking List!
Realised your IA results aren’t as great as you thought? We can help!
Don’t stress if your results are lower than you thought! We have an excellent team of QCE tutors and mentors ready to help one-on-one at home or online!
Thinking of dropping an ATAR subject for Year 12? Read more about it in this article!
Our tutors have experienced exactly what you’re going through right now — the same IAs and externals you’ll be sitting at the end of the year — so we’ve got all the right tips and knowledge to share with you, to help you improve your marks!
We’ve also got an ENTIRE library of QCE study note summaries and practice questions, to get you as ready as possible before your next assessment!
To find out more and get started with an inspirational tutor and mentor get in touch today!
Give us a ring on 1300 267 888, email us at [email protected] or check us out on TikTok!


