
Unfamiliar with what the problem-solving and modelling task (PSMT) for QCAA General Maths IA1 involves? Or maybe you have written up a report for a PSMT before, but you just need a refresher!
Whatever the case is, we’re here to help. You mainly do exams for General Maths, so this is pretty much the only IA that is an assignment.
Although there is no telling what the topics of choice will be, the structure of the report, as well as various hints and tricks regarding research and format, will still apply. So we’ll go over some important considerations, as well as an overall barebones structure breakdown to make sure you maximise your marks!
Let’s dive in!
What is a Maths PSMT?
Formulate
Solve
Evaluate and Verify
Conclusion
Appendix
What is a data analysis report for the QCAA General Maths IA1 PSMT?
A data analysis report explores or challenges a claim, aiming to prove it or disprove it by analysing datasets that are different from the ones originally used to arrive at the original theory.
In other words, your task is to find out whether a claim is true or false by collecting data, that you will analyse yourself. Your mathematical conclusions will either go with, or go against, the claim you’ve been asked to investigate.
Your mandate is to take the question given on the ISMG, and answer it clearly by the end, using maths and data.
It’s important to note that you will be given a page limit to stick to, rather than a word limit: this will be of 10 pages for the actual report, as well as an appendix (a space for tables and graphs) and a reference page.
Note: This means you should only include the graphs and tables that are essential to your explanation in the main body, not any superfluous ones. These will take up space and take away from your ability to use more words to get your ideas across.
Note that even though this assessment is marked internally, the QCAA does not allow your teachers to give specific individual feedback on the assignment!
You can easily reach out to resources like Art of Smart or a tutor to get specific PSMT feedback!
A Note About Referencing for the Maths PSMT
The referencing style will be specified by your teacher, but whenever writing about datasets obtained by someone else, or when citing concepts that do not come from your own understanding, you should always reference in-text.
The bottom line is, any reference you include in your reference list should be referenced at least once in the main body of the report for the Maths PSMT.
Aim for about ten references: these may be full datasets, explanations regarding phenomena that your data can’t explain, or opinions regarding the claim — potentially anything can be used as a source if it serves to support your analysis!
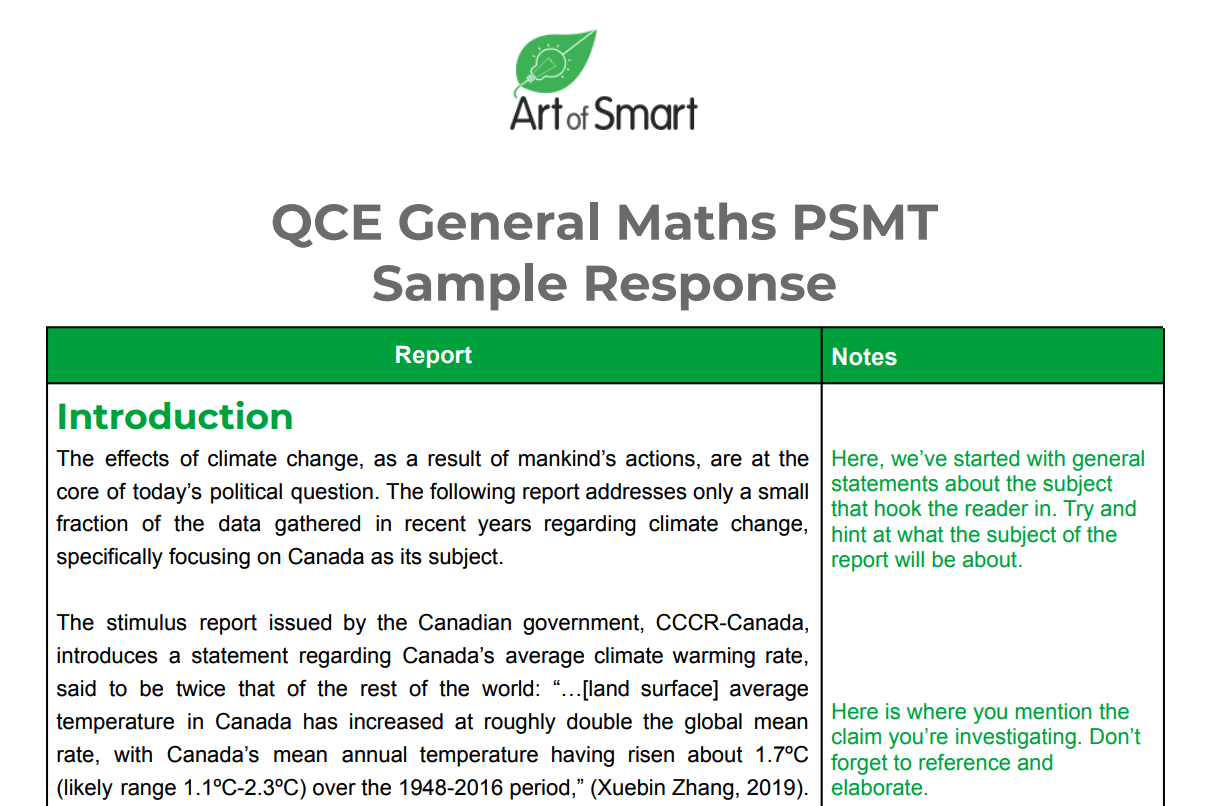
Here’s a preview of our General Maths PSMT sample response:
Download our QCAA General Maths IA1 PSMT Sample Response now!
Formulate
Find out what PSMT mark you need to be on track for an ATAR above 90…
Introduction and Context
Your introduction should discuss the general topic and issue at hand, then arrive at the claim in question. Essentially, the aim is to start general and get progressively more specific until we state the claim — take a look at this example:
The effects of climate change, as a result of mankind’s actions, are at the core of today’s political question. The following report addresses only a small fraction of the data gathered in recent years regarding climate change, specifically focusing on Canada as its subject.
The stimulus report issued by the Canadian government, CCCR-Canada, introduces a statement regarding Canada’s average climate warming rate, said to be twice that of the rest of the world: “…[land surface] average temperature in Canada has increased at roughly double the global mean rate, with Canada’s mean annual temperature having risen about 1.7ºC (likely range 1.1ºC –2.3ºC) over the 1948– 2016 period,” (Xuebin Zhang, 2019). The claim was subsequently paraphrased by a further stimulus, a BBC article, reporting much the same conclusion: “Canada is warming on average at a rate twice as fast as the rest of the world, a new scientific report indicates,” (BBC News, 2019).
Next is our research aim. By the time you’ll have started writing the report, the data will have been analysed, so you’ll know whether your data demonstrates or challenges the claim.
It is time to put this into words; have a look this example for reference:
The report tentatively foresees the rate of Canada’s warming being double that of t. Thus, it would deem the statement true. It also foresees an increasing warming rate in the last 10 to 20-year period, with this being thrice or four times higher than that of the previous years.
Investigation Parameters for the QCAA General Maths IA1 PSMT

This section sets out the parameters of your investigation, or the criteria with which you have selected your dataset. This is so that your analysis appears less superficial, and more realistic.
Let’s suppose that our task is to investigate whether it is true that islands around the world are disappearing at a mean rate of 5mm per year due to sea level rise.
Here we have three parameters to consider: first, we must define the term ‘island’, as we couldn’t possibly take into account data from every single bit of land above sea level, as the variance in Island size is huge.
Second, you are not going to be able to accurately obtain and analyse data from islands in every corner of the globe; some of these places are hard to reach and constantly beaten by storms, so you won’t find data for every island you intend to include in your data.
And finally, we must decide at what point in time we collect the data.
The parameters section is there for you to explain that, for all the reasons listed above, your best bet at tackling this question is to pick 2 or 3 big islands from the southern and northern hemisphere, gather data across the last 10 years in terms of sea level rise, and compare the results.
Ultimately, the research parameters will be unique to the assessment question.
But remember, you don’t have a UN-Class team of researchers, millions in budget and a lifetime at your disposal. Be realistic regarding the data you can analyse!
Doing this PSMT at the start of Year 11? Here’s why you might be feeling that Year 11 is so hard…
Observations and Assumptions
Observations
These are the things you may have come across while researching (so you’ll have a few in-text references here). It can be effective to use diagrams and statistics. Aim for at least four.
Examples:
- The density of the materials used can heavily impact the weight and durability of the pendant
- Pendants sizes average between 9.5-25.4mm
- Fashion pendants on average cost between $10-$99 (Lovisa, 2020)
- All measurements must be positive values, so when graphing, pendant must entirely be in the first quadrant to avoid negative values
Assumptions
As the task can be somewhat vague, some assumptions will have to be made in order to make it more specific. Aim for at least four.
Ensure you justify the reasons for/implications of each assumption.
Examples:
- The pendant is for the average adult consumer, and will be considered ‘fine jewellery’ and so will have dimensions, weight and cost as such
- The entire area of the pendant will have the same depth (meaning that the pendant will be flat), as creating variety in depth will make the volume of the pendant difficult to calculate
- The domains and ranges of the functions will correlate to the dimensions of the pendant (i.e. 1 unit = 1cm)
- The cost calculated is the estimated cost for the materials of the pendant, not including the construction cost
Solve
Analysis
This section is also heavily dependent on the claim you’re investigating — but that doesn’t mean there is no set way to go about it. We’ve got 6 great tips you can follow to ace the analysis of your PSMT for General Maths!
Tip 1: Remove Outliers from Your Data
Before you begin the analysis, remove any outliers from your data, or alternatively, explore the effect that outliers have when removed from the dataset compared to when they are included.
Tip 2: Focus on the Bigger Picture
Next, make sure to focus on the bigger picture. Pay attention to general trends rather than isolated fluctuations in the data, and comment on their correlation.
A good way to make sure this is executed is to comment always on the correlation coefficient and the coefficient of determination. These will be the main indications as to whether two variables are associated with each other.
Tip 3: Don’t State if Something is True or False
Always keep away from stating something is true or false. You’re never going to have the full picture or the full data, or the time to meticulously analyse it, which leads us to the next point…
Refrain from using ‘absolute’ language… instead, say something like “the data suggests xyz to be correlated to abc…”
Tip 4: Pay Attention to Your Data Sources
Who are they affiliated to? Are they credible? Reputable? You’ll get to comment on all of these factors in the limitations section of your assignment.
Tip 5: Remember That Correlation Doesn’t Always Equal Causation
Correlation does not necessarily mean causation. Two variables may be correlated, but not directly affect each other.
Use this as an opportunity to discuss the ‘Three Cs’: Coincidence, Common Response, & Confounding!
Tip 6: Compare the Data!
The most important of all of them. COMPARE. It might be worth purposefully getting data that challenges yours.
Commenting on their similarities and differences will maximise your marks. Comparison of different datasets to the claim is essential to score high on this assessment.
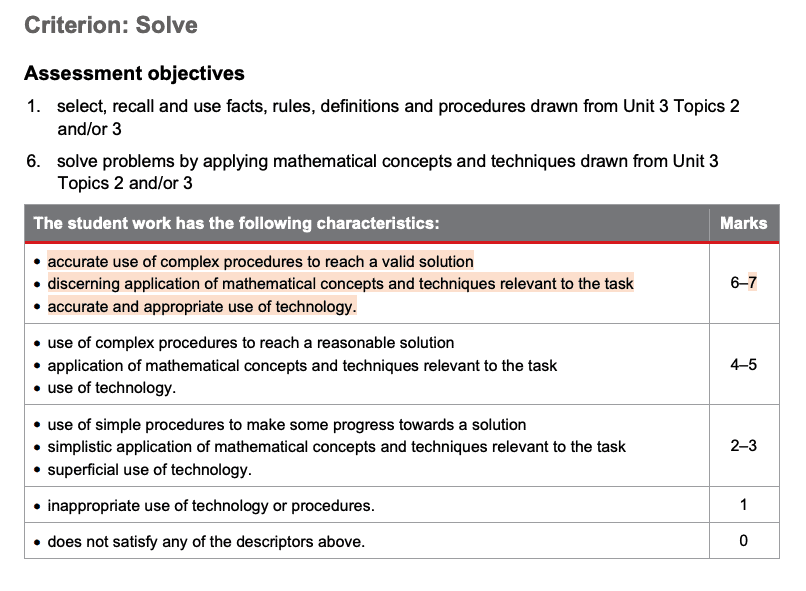
There is no set way to divide your analysis. We suggest dividing the analysis into smaller sections, each of which deals with a specific aspect of the dataset, or different datasets together. This structure will ensure you achieve the best possible marks. Have a look at this marking guide from QCAA:
Displaying Results
This section is a breeze to write. Just summarise what you’ve found in your analysis compared to the claim!
Again, remember to focus on general trends, and state their plausibility with regards to your hypothesis. Do they mostly support your hypothesis or challenge it?
Here’s a preview of our General Maths PSMT sample response:
Download our General Maths PSMT Sample Response now!
Evaluate and Verify
Reasonableness
Discuss which aspects of your design/model are reasonable and which aspects are unreasonable and provide justification. Explain how the unreasonable aspects could be improved.
Include aspects that were not taken into account and may have an effect on the design/model. Also, revisit the assumptions and consider any revisions that could be made to improve your design/model.
Stuck doing your actual IA1 PSMT at the end of Year 11? Here are some helpful tips for you to use… But if you haven’t done your IA1s yet, we’ve got everything you need to know in our QCE IA1 guide!
Strengths of the Model
What are the strengths of your model? Part of the evaluation of your work is to identify the strengths of the analysis. This can be anything from the accuracy of the data to the method and parameters you chose to set yourself when analysing.
Limitations of the Model
This section deals with the possible disadvantages of the analysis you’ve made. In order to evaluate your work effectively, ask yourself in what ways your work could be criticised, and what you wish you could have had to make your analysis more accurate or attainable.
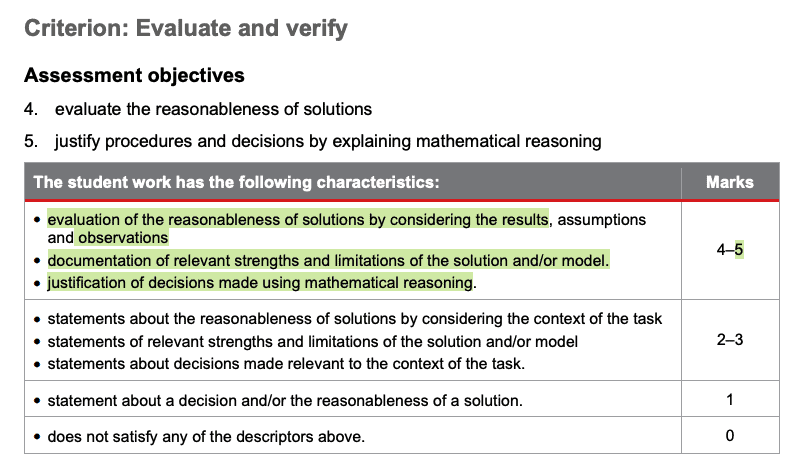
It’s good in this section to write about the sources you used in your investigation, as well as the source from which the original claim was taken; discuss any bias or advantages that the sources might have in terms of strength and reliability. Here is the marking guide for more help:
Evaluation of the Claim
Think of this as a summary of all your results, written in relation to the claim. The key questions you should be answering here are:
- What part of my results supports/challenges the claim?
- What are the limitations that could have improved my accuracy?
- Is the data analysed enough to get to a valid conclusion? Why?
Conclusion
Group the deductions you have made in the evaluation of the claim in a few sentences. It is unlikely you will be able to completely prove or disprove your research statement. There just isn’t enough data if the claim is complex.
What you can say is that the claim is either plausible or implausible considering your research. Refer to this example and the earlier marking criteria.
It is thus evident that the results across the period of time examined (if considered in its entirety) corroborate the claim forwarded by the CCCR Canada Report. However, the claim can be challenged if examining the results that comprise the last fifteen to twenty years, where Canada’s warming rate is much lower than that of the compared subjects.
Appendix
In the main body of the report you will have included the few graphs and tables that showcase the most important trends of your data. The appendix, however, is the place where you must show your mathematical process. It should include:
- Graphs
- Tables
- Datasets (if these are not too large)
- Any images you’ve referred to
- Operations and calculations
- Excel formulas (if this is the software you’re using to analyse the data)
We get that this assessment is confusing! Check out our maths experts in Brisbane for more help!
Here’s a preview of our General Maths PSMT sample response:
Download our QCAA General Maths IA1 PSMT Sample Response now!
When you receive your results for this task, you should plug them into our QCE Cohort Comparison Tool to see how you’ve done compared to your cohort.
There you have it!
Now that you know exactly what to include in your QCAA General Maths PSMT report, it’s time to ace the assignment! Always remember to refer back to the marking guide to ensure that you’re doing exactly what the assessment is asking of you.
If you’re looking for other resources to help you study for QCAA General Maths, check out our practice questions and guides below:
- Unit 3 General Maths IA2 Short Answer Practice Questions
- Unit 4 General Maths IA3 Short Answer Practice Questions
- The Ultimate Guide to QCAA General Maths Unit 3: Bivariate Data, Sequences and Change, and Earth Geometry
- The Ultimate Guide to QCAA General Maths Unit 4: Investing and Networking
- General Maths Multiple Choice Practice Questions for Unit 3 & 4 External Assessment
If you’re studying Maths Methods check out our guide to writing a PSMT here!
Are you looking for some extra guidance with the QCAA General Maths IA1 PSMT?
We have an incredible team of QCE tutors and mentors!
Still looking for help? One of our Brisbane-based Maths tutors can offer one-on-one tutoring sessions to help you ACE your PSMT!
We can help you master the General Maths syllabus and ace your upcoming General Maths assessments with personalised lessons conducted one-on-one in your home or online!
We’ve supported over 8,000 students over the last 11 years, and on average our students score mark improvements of over 20%!
To find out more and get started with an inspirational QCE tutor and mentor, get in touch today or give us a ring on 1300 267 888!
Vittorio Manessi is an Art of Smart tutor based in Queensland studying environmental science. He was one of the first Year 12 students to study under the new ATAR system in Queensland. He enjoys Maths, Science, English and Ancient History and is keen to share his knowledge of the QCE by making awesome resources.

